This Streamlit app allows users to explore Berlin’s land use patterns on a color-coded map, divided into square grid tiles and clustered by land use composition.
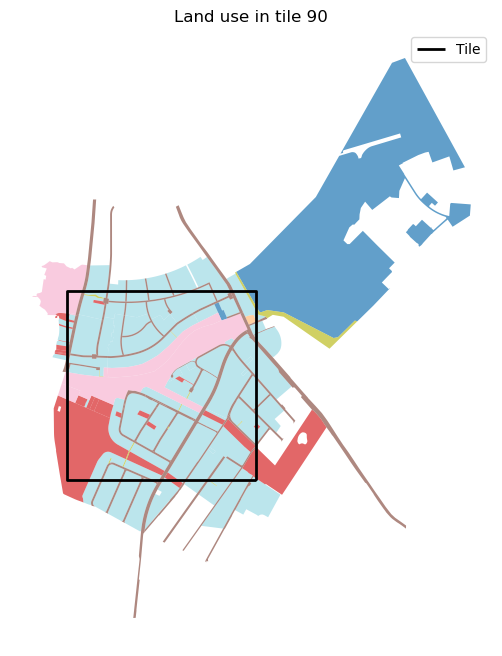
Example of one 1000 m² land use tile
This interactive land use map of Berlin visualizes the proportions of different land use categories within 1000 m² tiles based on open geospatial data. Each land use polygon is intersected with a grid of square tiles, and the proportion of each land use area within each tile is calculated. These proportions are used as features for unsupervised k-means clustering, grouping tiles into five land use cluster:
Recreation/ Nature/ Lakeside
Forest
Urban Residential
Agriculture
Urban-Industrial
The results are rendered on an interactive map using Folium, where each tile is color-coded and includes a popup with the land use composition. Users can input any Berlin address to locate it on the map. The data used in this Streamlit App is openly accessible here. It was published in 2024 by Senatsverwaltung für Stadtentwicklung, Bauen und Wohnen Berlin.